2. TensorBoard로 시각화하기
in Data on Deep Learning
파이썬을 이용한 머신러닝, 딥러닝 실전개발 입문
파이썬을 이용한 머신러닝, 딥러닝 실전개발 입문 책을 바탕으로 코드 리뷰 및 정리를 했습니다. 자세한 내용은 책과 강의를 참고해주세요.
link: github
5. 딥러닝
5-2. TensorBoard로 시각화하기
- Tensorflow의 데이터 흐름을 시각화 하는 도구
- 로그데이터를 저장할 폴더, 출력코드 한줄이면 사용할 수 있다.
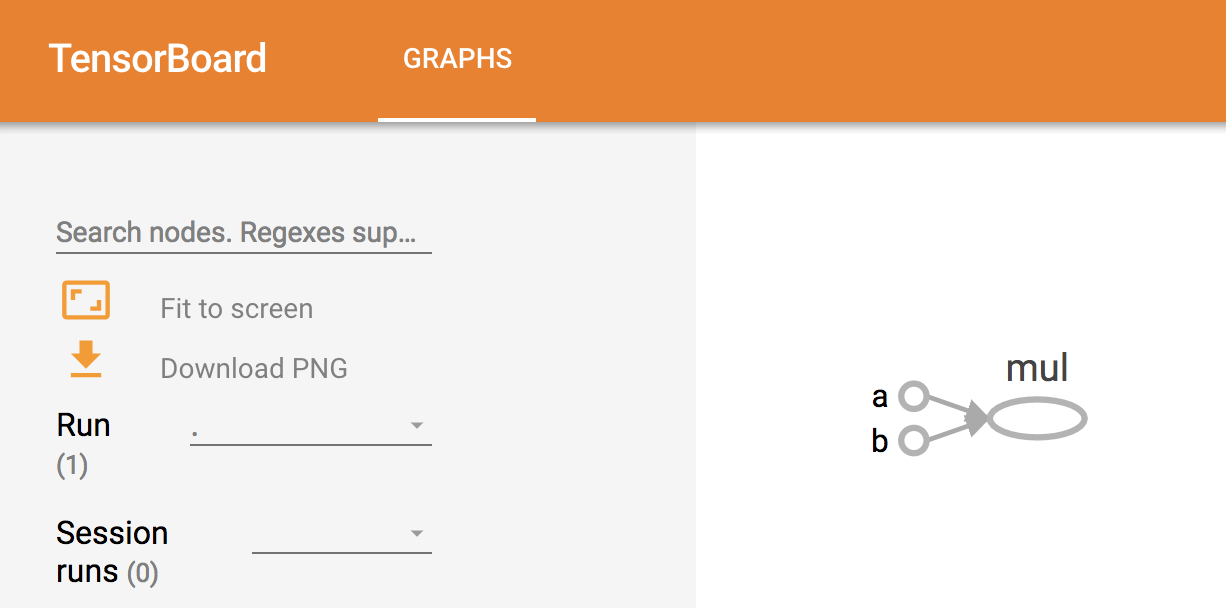
import tensorflow as tf

#데이터 플로우 그래프 구축
a=tf.constant(20,name="a")
b=tf.constant(30,name="b")
mul_op=a*b

#세션 생성
sess=tf.Session()

#TensorBoard 사용하기
tw=tf.summary.FileWriter("log_dir", graph=sess.graph) #log_dir폴더에 그래프 생성

#세션 실행하기
print(sess.run(mul_op))
‘log_dir’이란 폴더안에 데이터가 출력되어 있을 것이다.
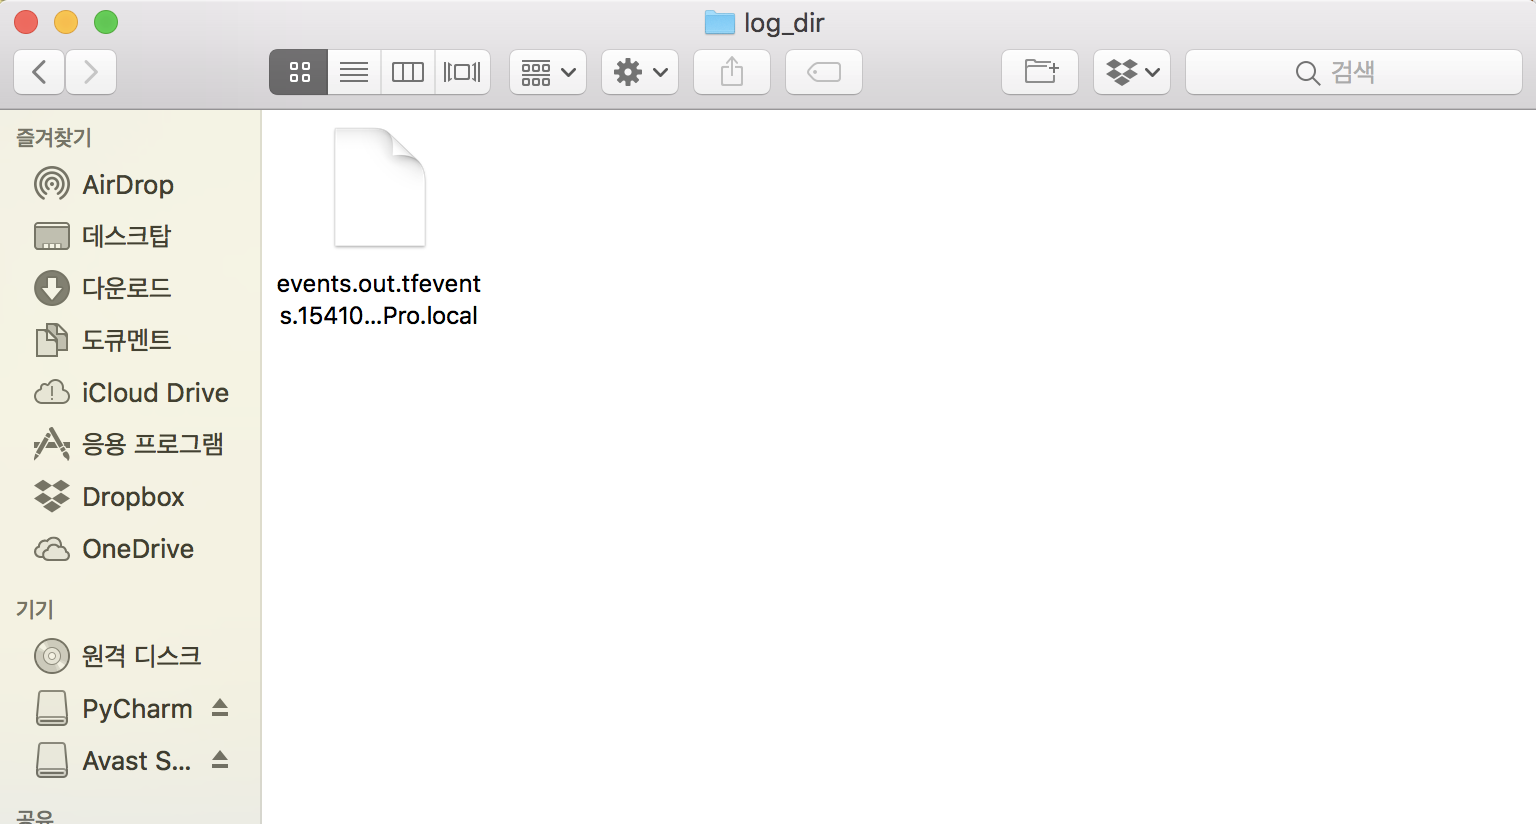
이 파일을 여는 법은 다음과 같다.
$ tensorboard --logdir=log_dir
터미널에 위의 명령어를 입력하면 아래와 같이 파일을 볼 수 있는 주소를 안내해 준다.
TensorBoard 1.10.0 at http://...-MacBook-Pro.local:6006
위의 안내를 따라 localhost:6006 에 접근하면 아래와 같은 텐서보드 화면을 볼 수 있다.
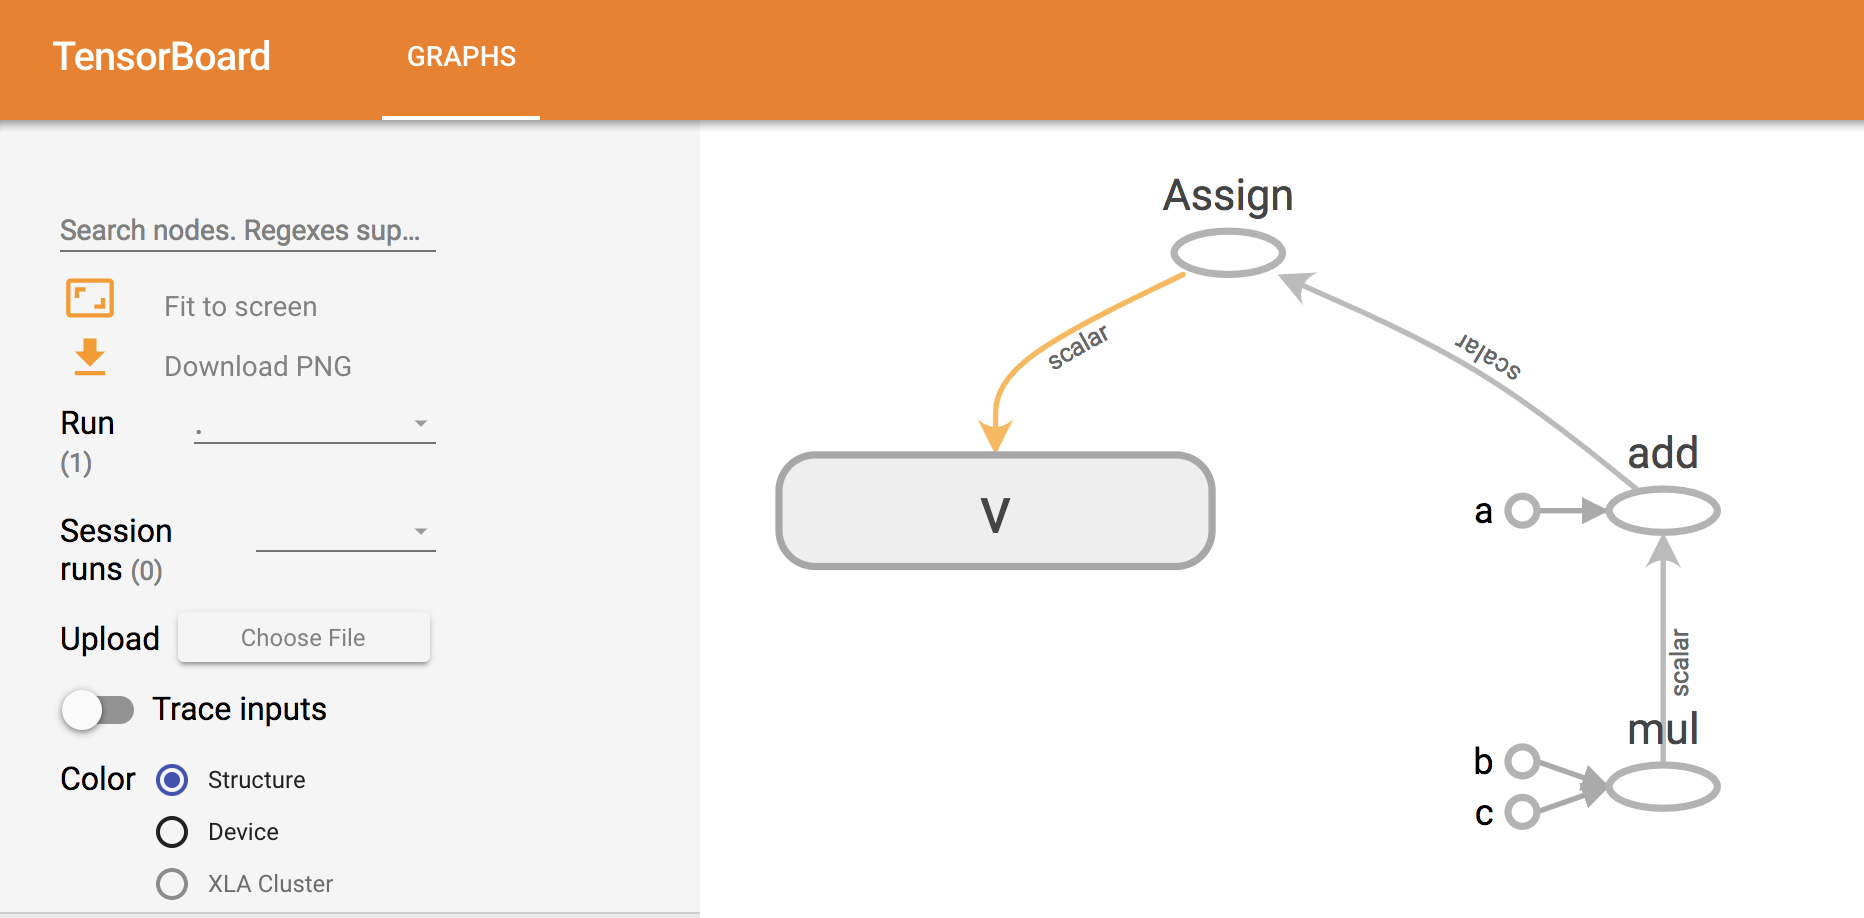
이번엔 조금더 복잡한 모델을 실습해보자.
import tensorflow as tf

#상수와 변수 선언
a=tf.constant(100,name="a")
b=tf.constant(200,name="b")
c=tf.constant(300,name="c")
v=tf.Variable(0,name="v")

#곱셈 수행 그래프 정의
calc_op=a+b*c
assign_op=tf.assign(v, calc_op) #연산을 변수에 대입

#세션 생성
sess=tf.Session()

#TensorBoard 사용하기
tw=tf.summary.FileWriter("log_dir", graph=sess.graph)

#세션 실행하기
sess.run(assign_op)
print(sess.run(v))
터미널에서 다음과 같이 수행한다. 로그 내부의 파일을 제거한 후 실행하는 명령어이다.
$ rm log_dir/*
$ python3 tensorboard.py
$ tensorboard --logdir=log_dir
이후 “localhost:6006”에 접근하면 다음과 같은 텐서보드를 얻을 수 있다.
이번엔 앞에서 계속 활용했던 “bmi.csv” 데이터를 텐서보드에 활용해 보았다.
#bmi.csv를 읽고 tensorflow를 통해 학습시킴
import pandas as pd
import numpy as np
import tensorflow as tf

#csv 파일 로드
data=pd.read_csv("bmi.csv")


#정규화
data["height"]=data["height"]/200
data["weight"]=data["weight"]/100

#레이블을 배열로 변환하기
#- thin=(1,0,0) / normar=(0,1,0) / fat=(0,0,1)
bclass={"thin":[1,0,0],"normal":[0,1,0],"fat":[0,0,1]}
data["label_pat"]=data["label"].apply(lambda x: np.array(bclass[x]))

#테스트를 위한 데이터 분류
test_csv=data[15000:20000]
test_pat=test_csv[["weight", "height"]]
test_ans=list(test_csv["label_pat"])

#데이터플로우 그래프 구축하기
#플레이스홀더 선언하기
x=tf.placeholder(tf.float32, [None,2]) # 키와 몸무게 데이터 넣기
Y=tf.placeholder(tf.float32, [None,3]) # 정답 레이블 넣기

#변수 선언하기
W=tf.Variable(tf.zeros([2,3])) #가중치
b=tf.Variable(tf.zeros([3])) #bias

#소프트맥스 함수정의
y=tf.nn.softmax(tf.matmul(x,W)+b) #행렬곱

#모델 훈련
cross_entropy=-tf.reduce_sum(Y*tf.log(y))
optimizer=tf.train.GradientDescentOptimizer(0.01) #0.01: 학습계수
train=optimizer.minimize(cross_entropy)

#정답률 구하기
predict=tf.equal(tf.argmax(y,1), tf.argmax(Y,1))
accuracy=tf.reduce_mean(tf.cast(predict, tf.float32))

#세션 시작
sess=tf.Session()

#tensorboard사용
tw=tf.summary.FileWriter("log_dir",graph=sess.graph)

#세션 실행
sess.run(tf.global_variables_initializer()) #변수 초기화

#학습시키기
for step in range(3500):
    i = (step*100)%14000 #14000과 나눴을 때의 나머지
    rows=data[1+i:1+i+100]
    x_pat=rows[["weight","height"]]
    y_ans=list(rows["label_pat"])
    fd={x:x_pat, Y:y_ans}
    sess.run(train, feed_dict=fd)
    if step%500==0:
        ce=sess.run(cross_entropy, feed_dict=fd)
        acc=sess.run(accuracy, feed_dict={x:test_pat, Y:test_ans})
        print("step=", step, "cre=", ce, "acc=", acc)


#최종적인 정답률
acc=sess.run(accuracy, feed_dict={x:test_pat, Y:test_ans})
print("정답률=",acc)
실행하는 방법은 위와 같다.
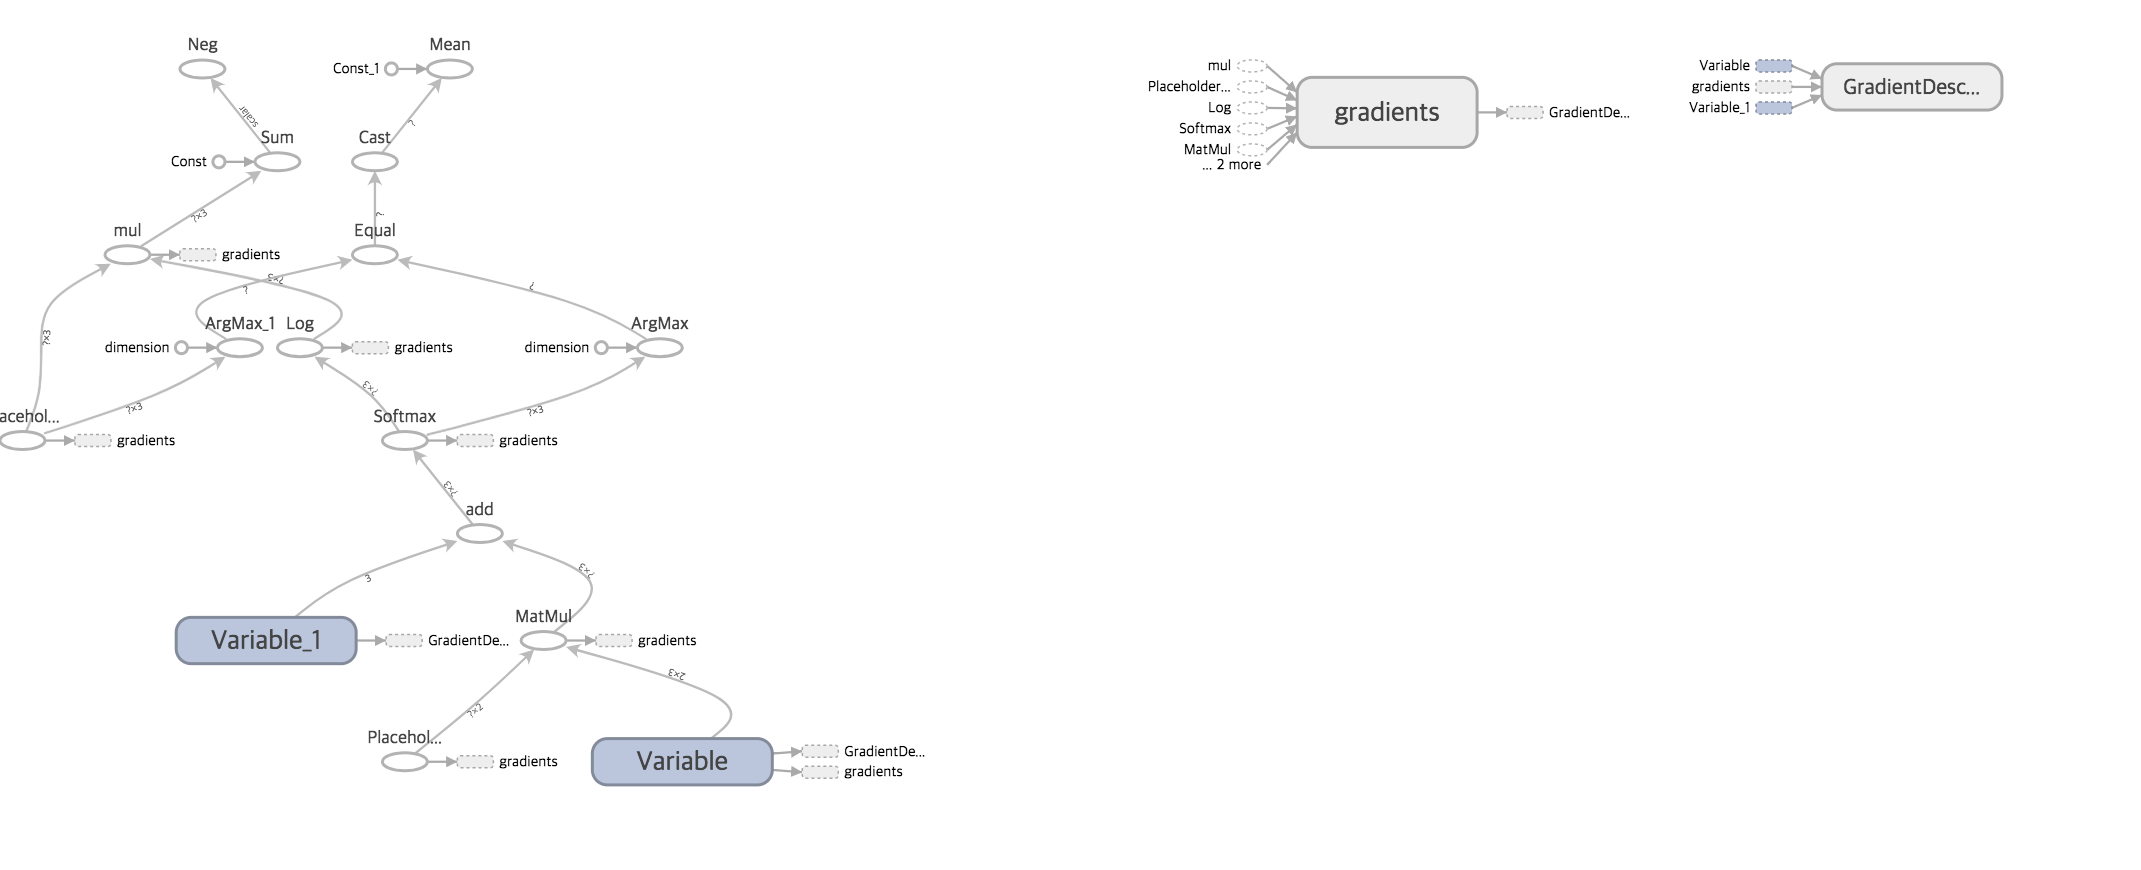
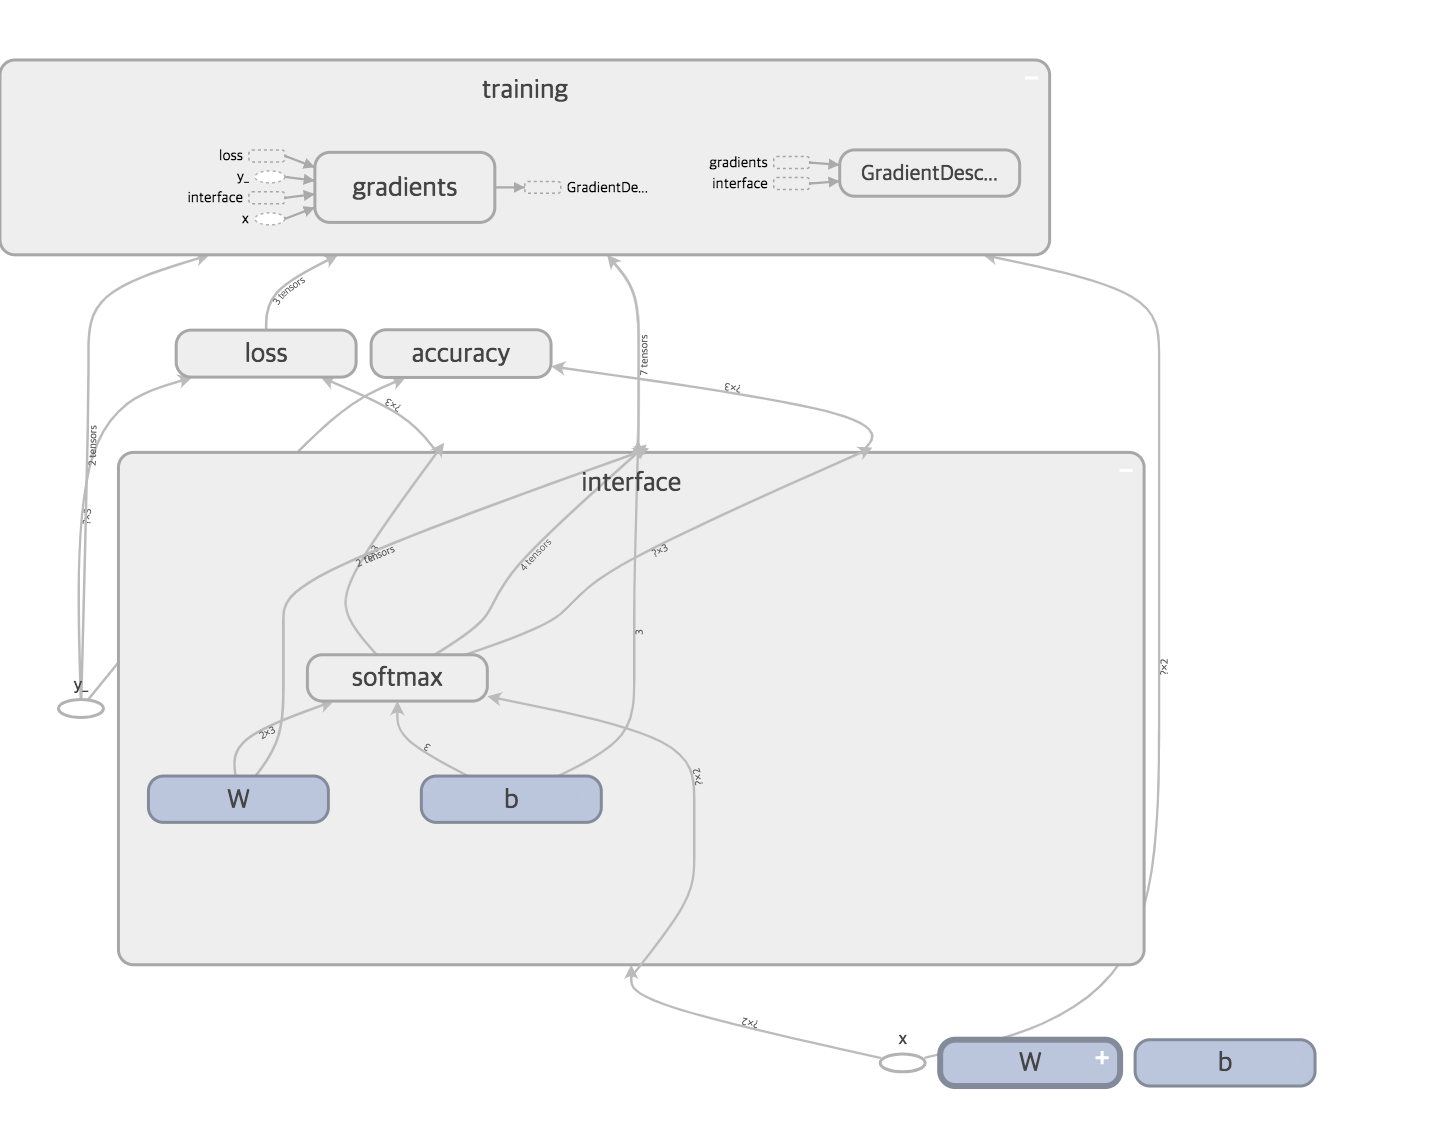
Tensorboard를 보기쉽게 정리하기
Tensorboard의 처리를 보기쉽게 정리할 수 있게 Tensorflow에서는 상수, 변수, 플레이스홀더에 name속성으로 이름을 붙일 수 있게 되어 있다. 앞에 bmi데이터를 활용하여 표현하면 아래와 같다.
import pandas as pd
import numpy as np
import tensorflow as tf

#csv 파일 로드
data=pd.read_csv("bmi.csv")


#정규화
data["height"]=data["height"]/200
data["weight"]=data["weight"]/100

#레이블을 배열로 변환하기
#- thin=(1,0,0) / normar=(0,1,0) / fat=(0,0,1)
bclass={"thin":[1,0,0],"normal":[0,1,0],"fat":[0,0,1]}
data["label_pat"]=data["label"].apply(lambda x: np.array(bclass[x]))

#테스트를 위한 데이터 분류
test_csv=data[15000:20000]
test_pat=test_csv[["weight", "height"]]
test_ans=list(test_csv["label_pat"])

#데이터 플레이스

x=tf.placeholder(tf.float32, [None, 2], name="x")
y_=tf.placeholder(tf.float32, [None, 3], name="y_")

#변수에 이름 붙이기
W=tf.Variable(tf.zeros([2,3]), name="W") #가중치
b=tf.Variable(tf.zeros([3]), name="b") #bias

#interface 부분 scope로 묶기
with tf.name_scope('interface') as scope: #tf.name_scope _ 처리를 스코프 단위로 분할 가능
    W=tf.Variable(tf.zeros([2,3]), name="W")
    b=tf.Variable(tf.zeros([3]), name="b")
    #소프트맥스 회귀 정의
    with tf.name_scope('softmax') as scope:
        y=tf.nn.softmax(tf.matmul(x,W)+b)

#loss 계산을 scope로 묶기
with tf.name_scope('loss') as scope:
    cross_entropy=-tf.reduce_sum(y_ * tf.log(y))

#training계산을 scope로 묶기
with tf.name_scope('training') as scope:
    optimizer=tf.train.GradientDescentOptimizer(0.01)
    train=optimizer.minimize(cross_entropy)

#accuracy계산을 scope로 묶기
with tf.name_scope('accuracy') as scope:
    predict=tf.equal(tf.argmax(y,1), tf.argmax(y_,1))
    accuracy=tf.reduce_mean(tf.cast(predict, tf.float32))

#세션 생성
sess=tf.Session()

#tensorboard사용
tw=tf.summary.FileWriter("log_dir", graph=sess.graph)

#세션 실행
sess.run(tf.global_variables_initializer()) #변수 초기화

#학습시키기
for step in range(3500):
    i = (step*100)%14000 #14000과 나눴을 때의 나머지
    rows=data[1+i:1+i+100]
    x_pat=rows[["weight","height"]]
    y_ans=list(rows["label_pat"])
    fd={x:x_pat, y_:y_ans}
    sess.run(train, feed_dict=fd)
    if step%500==0:
        ce=sess.run(cross_entropy, feed_dict=fd)
        acc=sess.run(accuracy, feed_dict={x:test_pat, y_:test_ans})
        print("step=", step, "cre=", ce, "acc=", acc)


#최종적인 정답률
acc=sess.run(accuracy, feed_dict={x:test_pat, y_:test_ans})
print("정답률=",acc)